How Much Does Your State Rely On Federal Aid?
It’s well known that some states tax their residents at a much higher rate than others. The reasons behind each states respective tax rate are of course very complex. One contributing factor that many do not consider is how much funding and aid a state gets from the Federal Government.
The Tax Foundation recently released a report detailing how much each state relies on assistance from the Federal Government. They used data from fiscal year 2016 which is the most recent available.
Why do states get Federal Aid? As the Tax Foundation puts it:
Federal aid is allocated to states for a variety of purposes, primarily to supplement state funding for programs or projects deemed to be of national interest. Some federal aid is awarded in the form of competitive grants, while other federal funding is allocated according to formulas established by law.
With that said, here is the map from the Tax Foundation report.

The top 5 states whose general revenue funds comprised the highest percentages in federal aid are,
- Mississipi, 43.4%
- Louisiana, 42.7%
- New Mexico, 41.2%
- Arizona, 41.2%
- Kentucky, 40.9%
The top 5 states whose general revenue funds comprised the lowest percentages in federal aid are,
- Virginia, 21.1%
- Hawaii, 22.7%
- Kansas, 23%
- North Dakota, 23.8%
- Utah, 25.7%
The Tax Foundation article claims “States that rely heavily on federal grants-in-aid tend to have sizable low-income populations and relatively lower tax revenues.”
I’ve done posts related to those two topics , income and taxes, before. So naturally my next inclination was to do some data sleuthing. Does the statement from the Tax Foundation above show in the data?
The assumption: the states that receive a greater portion of their general revenue funds as aid from the Federal Government should have generally lower median household incomes, and/or should also have generally lower tax revenues. I use “and/or” since one could outweigh the other. But if the assertion from the Tax Foundation is correct we should see one of the two factors to be true.
I’m aware that aggregating at the state level isn’t perfect analysis since states are obviously not homogeneous. But the federal aid data is only provided at the state level, rendering it impossible to get more granular.
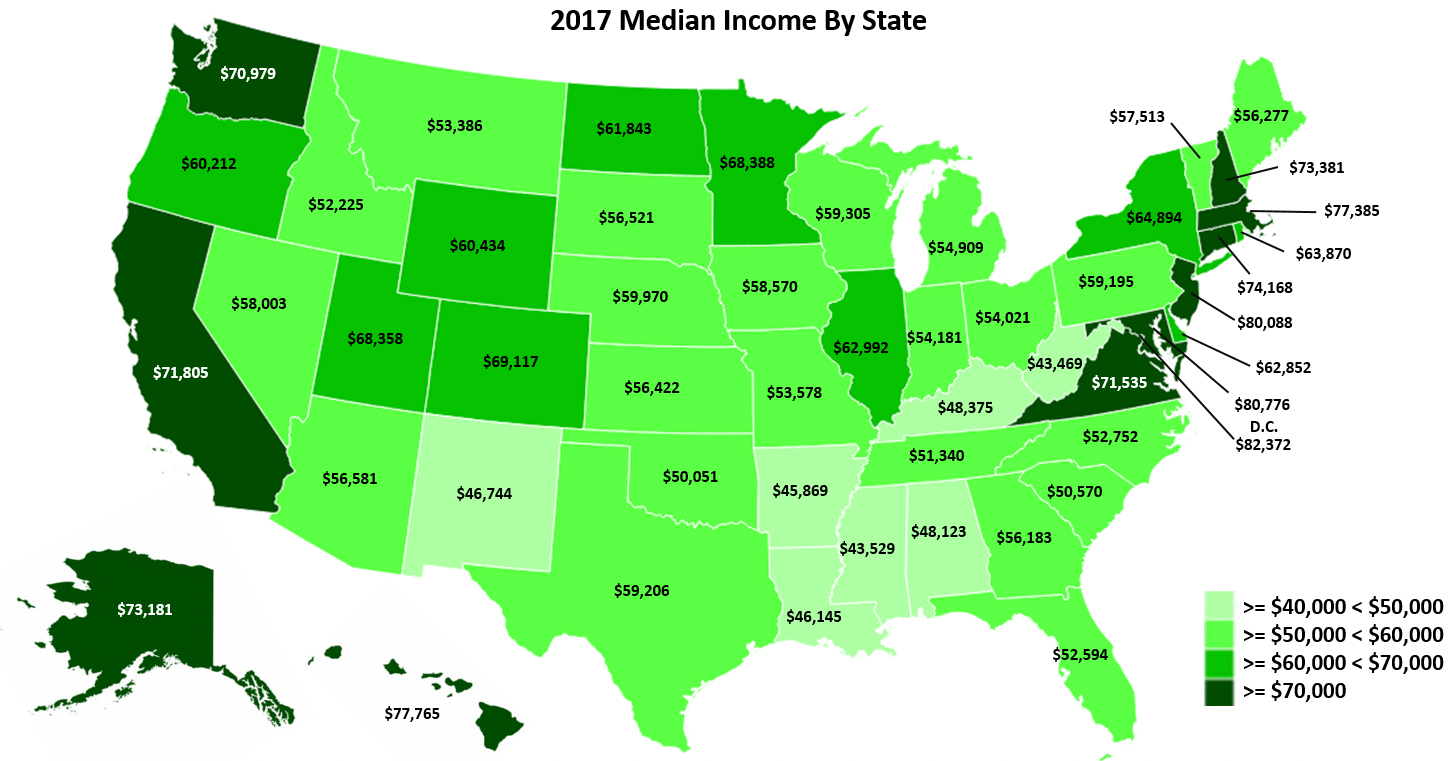
Regular readers will recall my last median household income map (2018 data has not yet been released):

To measure how much states collect in taxes WalletHub does an annual analysis of the respective tax burdens by state.
Here’s their interactive state tax map of overall tax burdens (defined as a combination of sales tax, property tax, and income tax, by percentage) from WalletHub:
I compiled the data from these three sources and entered it into a simple spreadsheet for analysis.
In the first column below the states are ranked by the amount of aid they receive from the Federal Government based on the first map above from the Tax Foundation (Mississippi first, Virginia last).
In the second column below is the median household income rank (not the income number but the rank out of 50) for each state from lowest to highest.
In the third column below is the tax burden for each state, again from low to high. Lower ranking states do not tax their citizens as high as higher ranking ones.
So based on the assertion from the Tax Foundation we should see some correlation in the ranking numbers. In other words, the states that get the most federal aid money (column #1) should also tend to have lower median incomes (column #2) and should also tend to have lower tax burdens (column #3).
| State | Federal Aid Money Received (Rank, Highest-Lowest) | Median Income Rank (Lowest-Highest) | Tax Burden Rank (Lowest – Highest) |
| Mississippi | 1 | 2 | 37 |
| Louisiana | 2 | 4 | 24 |
| New Mexico | 3 | 5 | 31 |
| Arizona | 4 | 23 | 19 |
| Kentucky | 5 | 7 | 30 |
| Montana | 6 | 14 | 9 |
| Tennessee | 7 | 10 | 3 |
| Wyoming | 8 | 32 | 14 |
| Alaska | 9 | 44 | 1 |
| Missouri | 10 | 15 | 13 |
| Alabama | 11 | 6 | 8 |
| West Virginia | 12 | 1 | 38 |
| Arkansas | 13 | 3 | 32 |
| Indiana | 14 | 17 | 27 |
| Oregon | 15 | 31 | 23 |
| Ohio | 16 | 16 | 40 |
| Vermont | 17 | 24 | 47 |
| Georgia | 18 | 19 | 15 |
| Maine | 19 | 20 | 48 |
| South Dakota | 20 | 22 | 7 |
| Oklahoma | 21 | 8 | 6 |
| New York | 22 | 37 | 50 |
| Michigan | 23 | 18 | 25 |
| Florida | 24 | 12 | 4 |
| Texas | 25 | 28 | 17 |
| Rhode Island | 26 | 36 | 44 |
| Idaho | 27 | 11 | 11 |
| Pennsylvania | 28 | 27 | 28 |
| California | 29 | 43 | 41 |
| New Hampshire | 30 | 45 | 5 |
| Iowa | 31 | 26 | 36 |
| Nevada | 32 | 25 | 20 |
| South Carolina | 33 | 9 | 12 |
| North Carolina | 34 | 13 | 21 |
| Colorado | 35 | 40 | 16 |
| Nebraska | 36 | 30 | 34 |
| Maryland | 37 | 50 | 39 |
| Washington | 38 | 41 | 18 |
| Massachusetts | 39 | 47 | 33 |
| Illinois | 40 | 35 | 43 |
| New Jersey | 41 | 49 | 42 |
| Connecticut | 42 | 46 | 45 |
| Delaware | 43 | 34 | 2 |
| Minnesota | 44 | 39 | 46 |
| Wisconsin | 45 | 29 | 35 |
| Utah | 46 | 38 | 22 |
| North Dakota | 47 | 33 | 29 |
| Kansas | 48 | 21 | 26 |
| Hawaii | 49 | 48 | 49 |
| Virginia | 50 | 42 | 10 |
As you can see the first five states on the list that get the most federal aid do generally have low median household incomes. They also, however, collect pretty substantial taxes from their citizenry as compared to the rest. But higher tax rates on lower incomes will still not generate as much revenue as more modest rates on high incomes.
The bottom of the list shows more correlation to support the assertion from the Tax Foundation. Most of the numbers are high. Those states get less federal aid, have higher household incomes, and generally tax their citizens at a higher rate.
Delaware is a noticeable standout with the second lowest tax rates in the country, but also ranking low in federal aid received.
The state that stood out the most to me was South Carolina, which is ranked #33 in federal aid received. That’s a pretty low ranking, but as you can see South Carolina has the 9th lowest median household income of the 50 states, and is ranked 12th in relative tax burden. So SC doesn’t tax their citizens very high, and their citizens don’t make very much money. Yet they’re also not receiving nearly as much federal aid as states with better numbers in these measures.
Like my other geo-data posts, I hope these resources can help you if you are considering a move or if you are living the nomadic lifestyle. Be sure to check out my Geoarbitrage Resources Page that has tons of great tools to help you find your perfect location.
I hope to continue to research various aspects of finance as related to geography going forward. And I certainly hope you find these kinds of posts helpful!


Really interesting data Dave. It is odd that South Carolina is such an outlier. Not sure why those elected in power there don’t push for more federal aid because of their demographics.
I’m sure there’s something behind it but I know very little about their politics
Nice article but it is does not tell the entire story, California may only get 32% of its budget paid for by the Feds and Mississippi gets a much larger percentage of 42% of their budget from the Feds but California has a 209 billion dollar budget and MS has a 23 billion dollar budget. So CA gets over 60 billion in Federal dollars almost 3 times the state budget of MS. Big difference in the amount of money they receive.
So one would expect states that have lower income people with that higher tax burden to still fall short on the money they need to run a state so the percentage of aid would be higher. Arizona is the outlier hear with a higher income level and still a large amount of Federal aid, maybe that is because all the retirees have ROTH IRA that are non taxable.
That’s just what came to my mind as reading this.
Thank you for the great post
You’re absolutely right Rick, these numbers are just percentages. But the budget numbers of the respective states probably line up relative to their populations, with some variance. California does indeed have a massive budget, but they also have 40 million people. That’s almost 12% of the population of the country. Mississippi has about 3 million people. So cuz I’m a geek and I love comments like yours I figured the amount of aid per person for those 2 states.
Cal– total budget = 209 billion
Fed Aid (32%) = $67.3 billion
Divided by population = $1682 per person
MS – total budget $22.3 billion
Fed Aid (43.3%) = $9.5 billion
Divided by population = $3196 per person
So it seems MS is getting more per person, based on their poverty rate most folks would agree with. I love data!
Interesting. Perhaps South Carolina doesn’t sponsor any projects deemed to be of national interest? 😉
I need to go on a field trip to explore this possibility
you gotta fight for the pork! remember that d’bag al d’amato, the longtime ny senator? he was a d’bag but he got a lot out of DC for new york for many years.
Too much pork for just one fork!! And yes I remember the name but since I’m not a New Yorker I didn’t know he was a pork connoisseur!
South Carolina stood out to me, especially as a spot I’ve lived. They could definitely use a few extra dollars their way.
Well you already paid your state taxes to them 🙂
Interesting stuff Dave! After looking at the data however, I think I’d be more likely to move to a state that falls somewhere in the middle for levels of federal aid. Call me biased, but the extremes on either end don’t seem appealing.
The more interesting question I think is: What is all this federal aid spent on? Infrastructure? Social programs? Balloon Animals?
Knowing how governments of all types work it would not surprise me if a state had a Dept. of Balloon Animals
That was my question too — how are those tax dollars used? I love the example Dave posted in the comment above regarding how much money is received for for each California resident versus each Mississippi resident. Again, I immediately wonder how that money is spent – for California, I automatically assume infrastructure and social programs, but I’m not familiar with Mississippi’s issues to know how they spend their money (except for maybe health care). On the other hand, I’m somewhat surprised California relies so heavily on federal money, considering the size of their economy and the number of wealthy residents within the state.
This is very neat. The tax burden column is the most interesting to me as an early retiree.
Oregon is in the middle, surprisingly. I thought our state income tax is very high compare to most states.
I guess sales tax and property taxes are higher in other states.
I want to check out Florida at some point. That seems like a good spot to me.
States have to get money from somewhere, so when one of the big taxes is low or non-existent, you can be sure another is higher.